
Documentation / Lastboard / Widgets
Telemetry Widget
On this page
The Telemetry widget shows how hard the machine running Lastboard is working right now. It is listed as Server Health in the widget picker.
Description
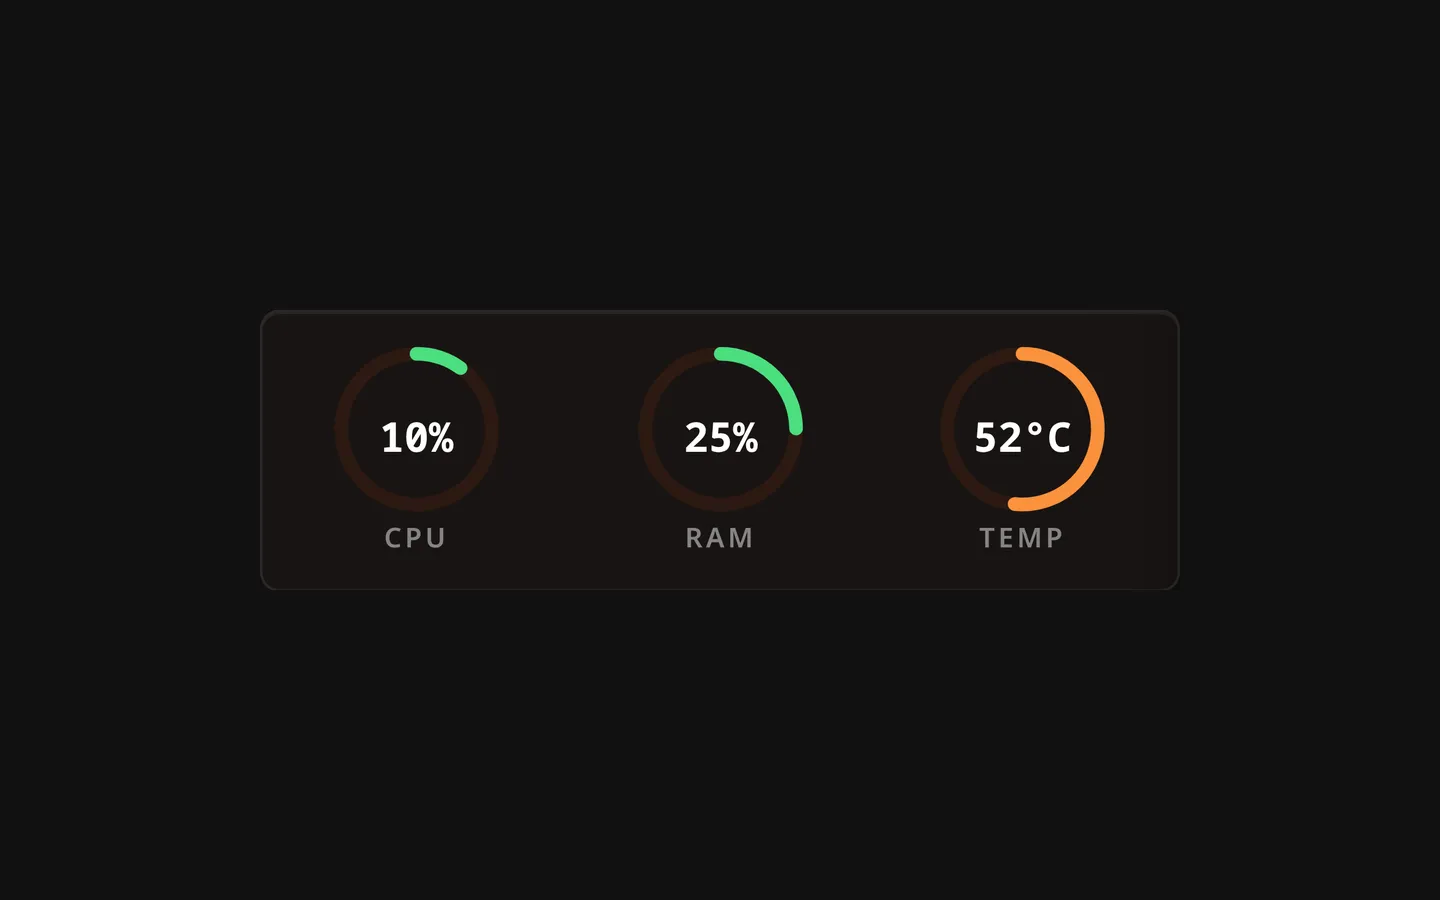
Up to three ring gauges — CPU, RAM and temperature. By default they show the server Lastboard itself is installed on, with no agent, no exporter and no configuration. Set a Source and they show another server instead — see Reading another server.
Metrics Displayed
| Metric | Meaning |
|---|---|
| CPU | Processor use, as a percentage. |
| RAM | Memory in use, as a percentage of the total. |
| TEMP | The server’s temperature reading. |
Each ring is green while the value is comfortable, amber as it climbs and red when it is high: above 60% and 80% for CPU and RAM, above 50 °C and 70 °C for temperature. Those two temperatures are the thresholds whichever unit you display.
Configuration Options
| Option | Default | Description |
|---|---|---|
| Source | This server | Where the numbers come from: This server, Glances, Netdata or Custom JSON. |
| Metrics | All three | Which of CPU, RAM and TEMP the widget draws. At least one has to stay on — the last one you try to switch off comes back. |
| Refresh Rate | 5s | How often the widget redraws, or asks the other server when it reads one: 5s, 10s, 30s or 1m. A widget saved earlier with 1s or 2s now runs at 5s. |
The Personalize tab adds a border color and a border width (Thin, Regular or Thick) for the widget’s card. The General tab begins with the Title — a name shown on the tile’s top border, like the one a section wears (leave it empty for none).
Saving the metrics resizes the widget. One metric takes one cell, two take two, three take three — so the gauges keep their proportions instead of stretching. The widget has no resize handle of its own in Edit Mode; this is how its width is set.
Reading another server
Pick Glances, Netdata or Custom JSON as the Source and enter the server’s address. Lastboard asks that server from its own side, so the other server has to be reachable from the machine Lastboard runs on, not from your browser.
| Source | What it reads | Notes |
|---|---|---|
| Glances | Glances 4, or 3 when 4 is not there | Enter the address of the Glances web server, for example http://192.168.1.20:61208. If Glances runs with a password, fill in Username (empty means glances, Glances’ own default) and Password. |
| Netdata | Netdata 1 and 2 | Enter the address of the agent, for example http://192.168.1.20:19999. |
| Custom JSON | Any URL that returns JSON | You say where each number sits, such as cpu.percent or sensors[0].temp. For RAM give either the percentage, or the used and the total (in the same unit). An optional Header name and Header value carry an API key. |
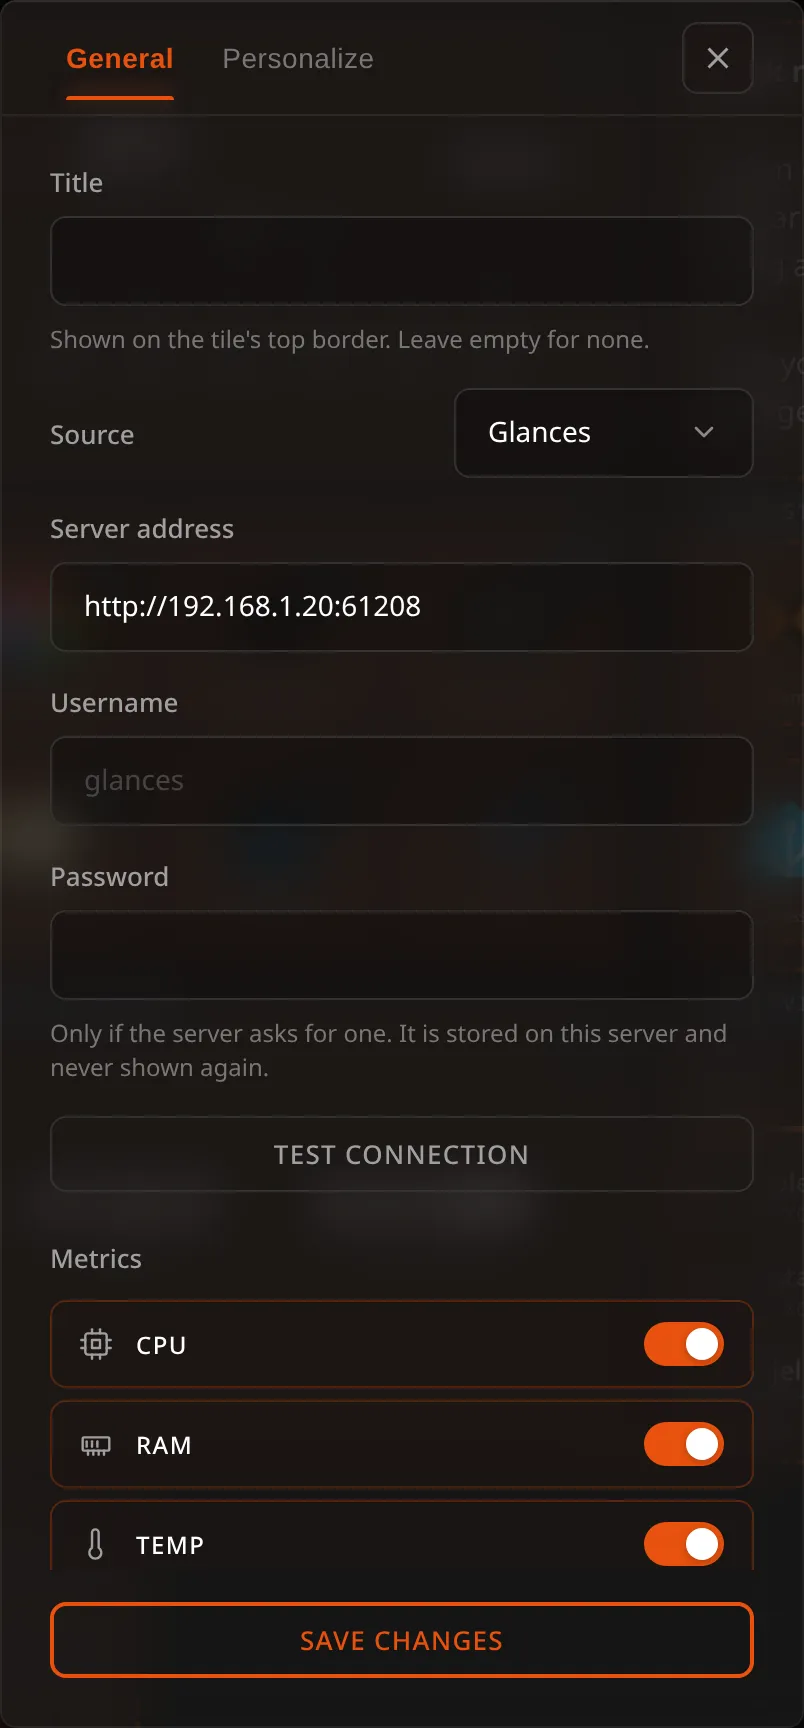
Test connection tries what is on the form, without saving: it tells you whether the server answered, which API version it speaks, and which of the metrics you chose it does not report.
- A metric the server does not report — the usual case is temperature on a virtual machine or a server without sensors — draws a grey ring with a dash, and hovering it says why. It is not drawn as 0.
- Temperature is the processor’s package reading. Disks, batteries, ACPI zones and Wi-Fi cards are ignored, so an NVMe drive never stands for the CPU.
- A server that cannot be reached turns every ring grey. One lost reading keeps the last numbers; the second in a row greys them, so a hiccup does not make the widget flash. Wrong or missing credentials grey it at once.
- Clicking the widget opens the server’s own page in a new tab — the address you entered for Glances and Netdata, and the optional Page to open on click for Custom JSON. Nothing opens while you are editing the board, and only
httpandhttpsaddresses are followed. - The password is a secret. It is stored on the Lastboard server apart from the widget, shown as dots, never sent back to your browser and left out of a dashboard export. A full backup does carry it, so give the backup a password if it will leave your server. Type a new one to replace it, or empty the box to remove it. Your browser only names the widget; the address and password are read on the server.
- Several widgets, or several open tabs, pointing at the same server share one reading for a few seconds instead of asking it each time.
Notes
- The numbers of This server are measured once a second and pushes the readings to every open Lastboard tab. It skips the measurement entirely when nobody has Lastboard open. The Refresh Rate setting decides how often the widget redraws with what arrives.
- Nothing is recorded. This widget is the present moment only — for a history of your services over time, see Monitoring & Uptime.
- Readings are read from the Linux kernel. On a server that is not running Linux there is nothing to read: CPU and RAM sit at 0%.
- Temperature needs a thermal sensor the server can read. Where there is none — which includes many virtual machines — the gauge shows -1 instead of a reading.
- The temperature unit follows Measurement Units in your preferences: °C or °F.