
Documentation / Lastboard / Monitoring
Monitoring & Uptime
On this page
Lastboard can watch your services, record their status over time, and alert you when something goes down. It turns the up/down dot on a bookmark into a full uptime history with latency charts, outage logs, and notifications.
What Gets Monitored
A service is monitored when its bookmark has a URL and a Status Position other than Off. Enable it per bookmark from the bookmark editor (see Bookmarks). Lastboard then probes that URL and shows an up/down indicator on the tile.
Monitoring adds history and alerting on top of that indicator.
24/7 Monitoring
Open Settings → Monitoring. Monitoring is yours: the 24/7 monitoring toggle, the check interval and the alerts apply to your own bookmarks, and every account sets them for itself. Someone who has not chosen yet starts from the values the server had when accounts got their own.
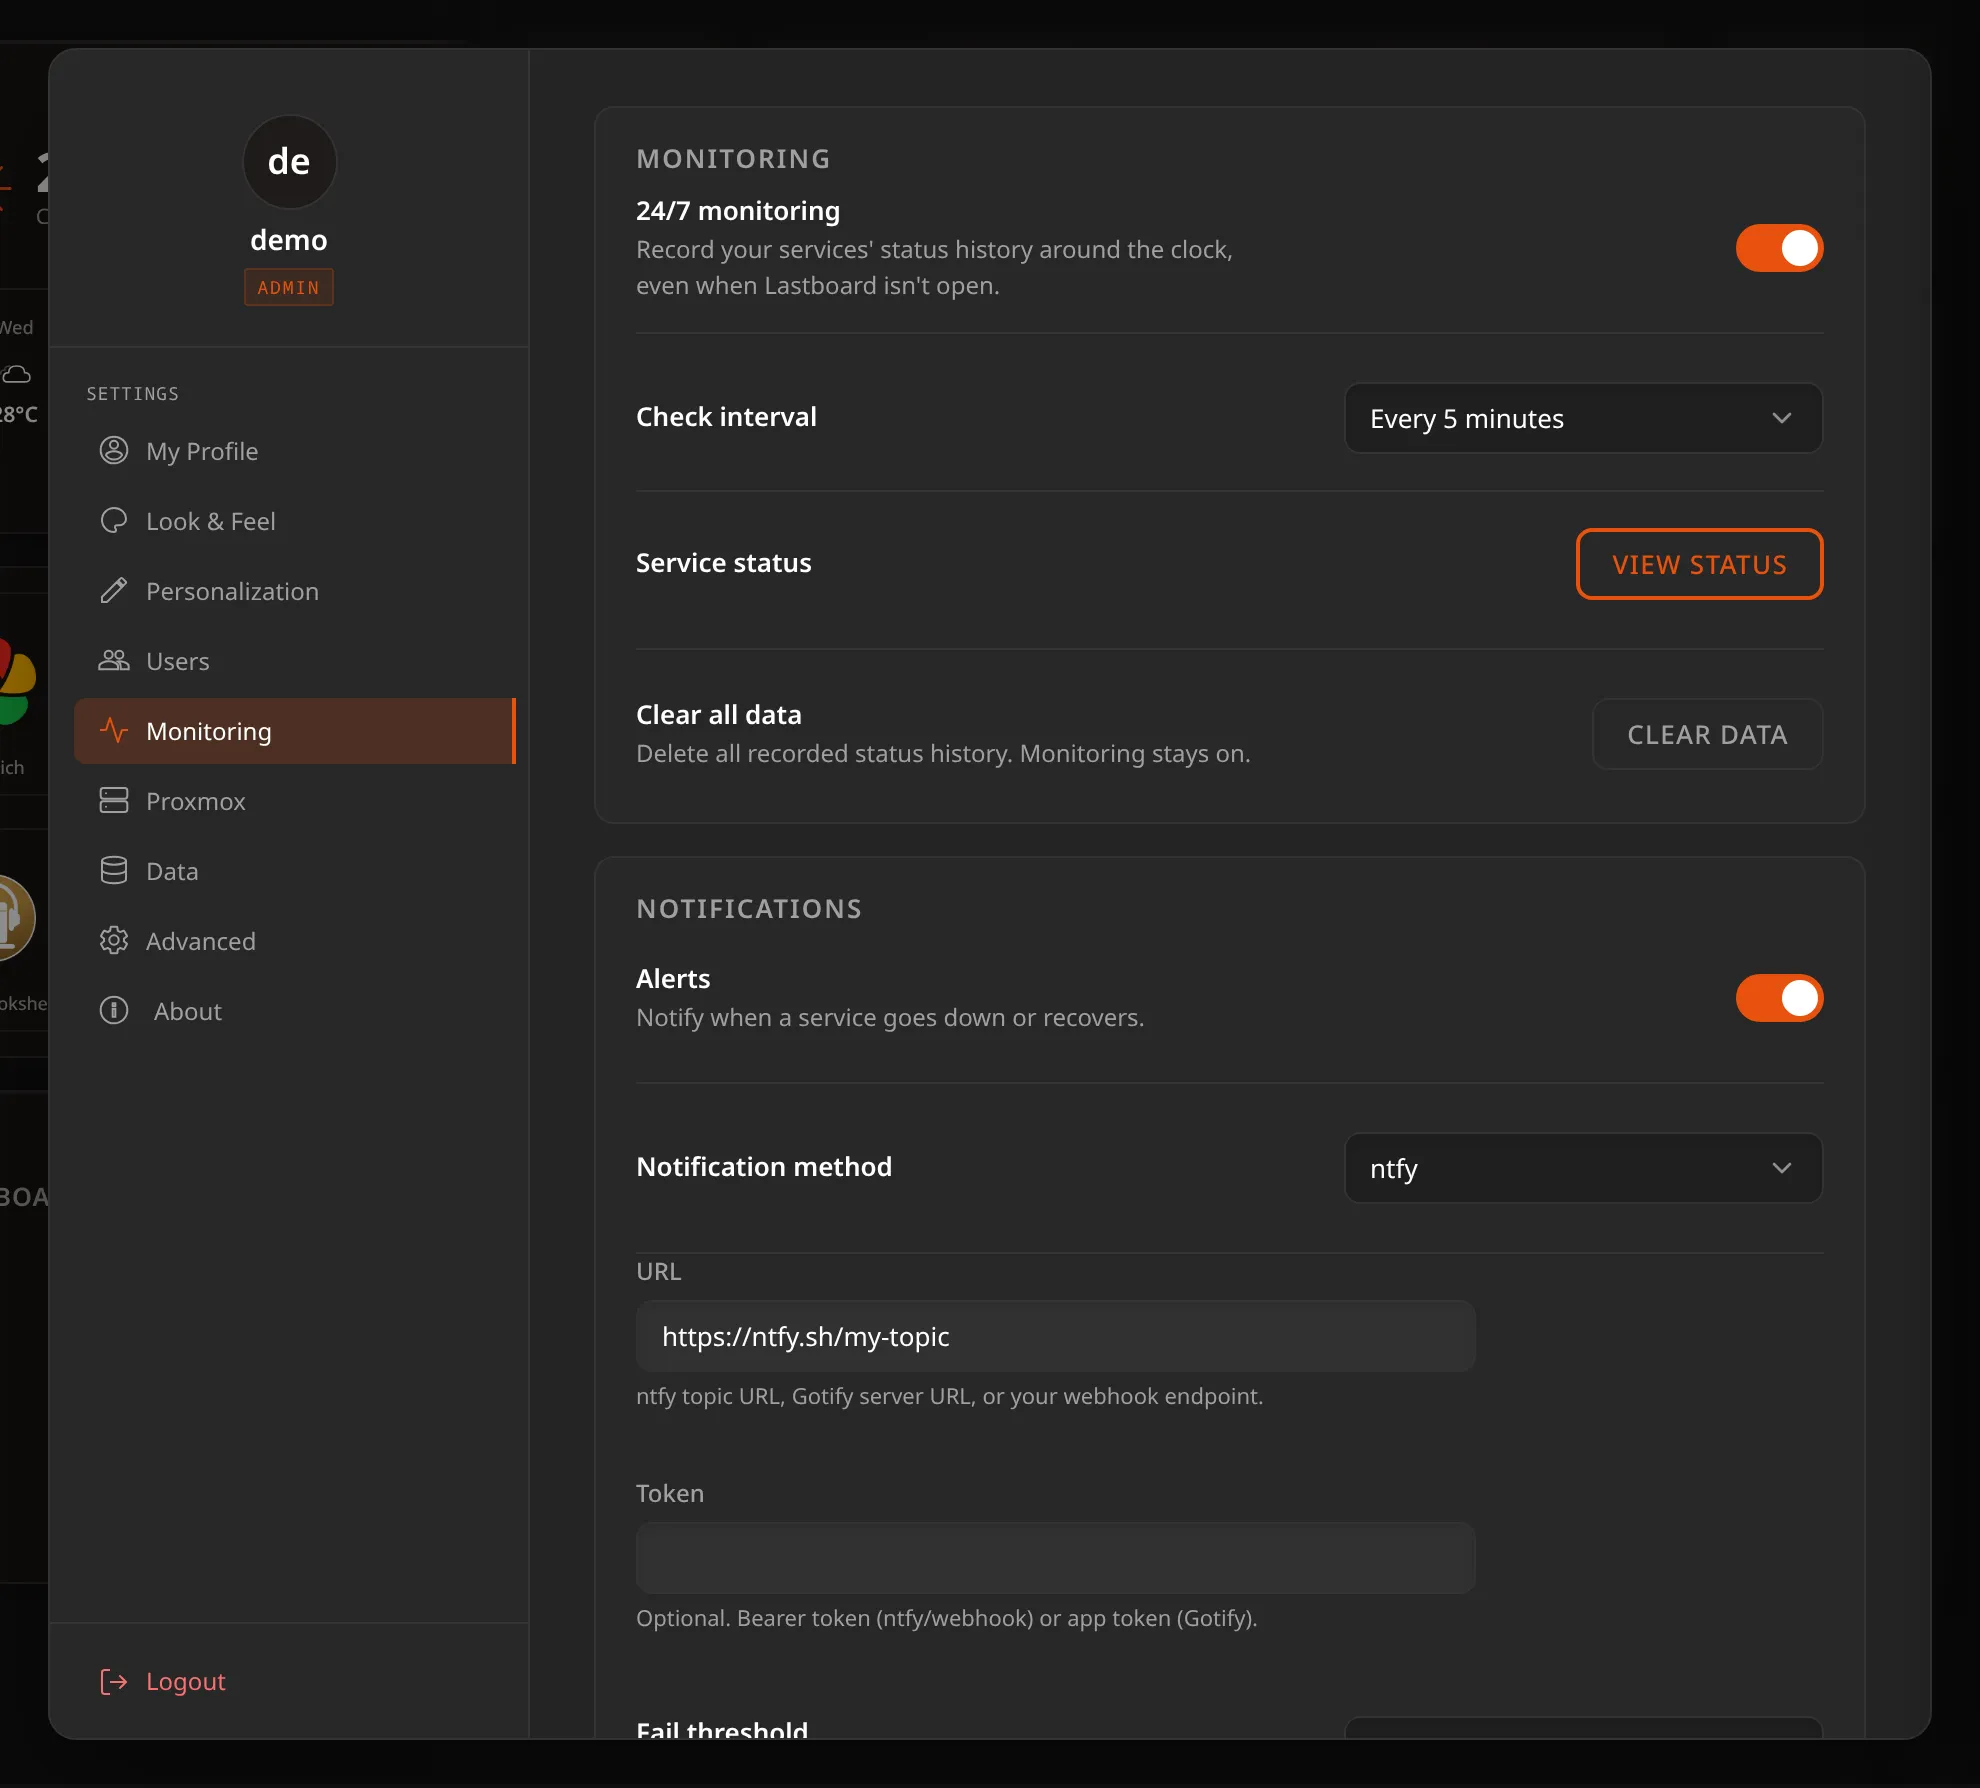
- Off (default) — while Lastboard is open, your browser asks the server to check each service. You get live up/down indicators, but nothing is recorded: no history and no alerts.
- On — the server probes every monitored service on the check interval, even when nobody has Lastboard open. This records a continuous history and is what enables alerts.
From this section you can also open the status page (View status) and clear all recorded history (Clear data).
Check interval
How often the server probes each service: 1, 5, 10, or 30 minutes (default 5 minutes). Shorter intervals give finer history at the cost of more requests.
History retention
Recorded checks are kept for 30 days; older data is pruned automatically each day.
Private services just work. Probes run from the Lastboard server, so services on private IPs (
10.x,192.168.x,.local) and those with self-signed HTTPS certificates are monitored without any extra configuration.
The Status Page
Back leaves the page, not Lastboard. The browser’s button, the mouse’s fourth button and a swipe from the edge of a phone all close the status page and return you to your board; closing it with the ✕ or with Escape takes its history step with it, so nothing is left behind to press.
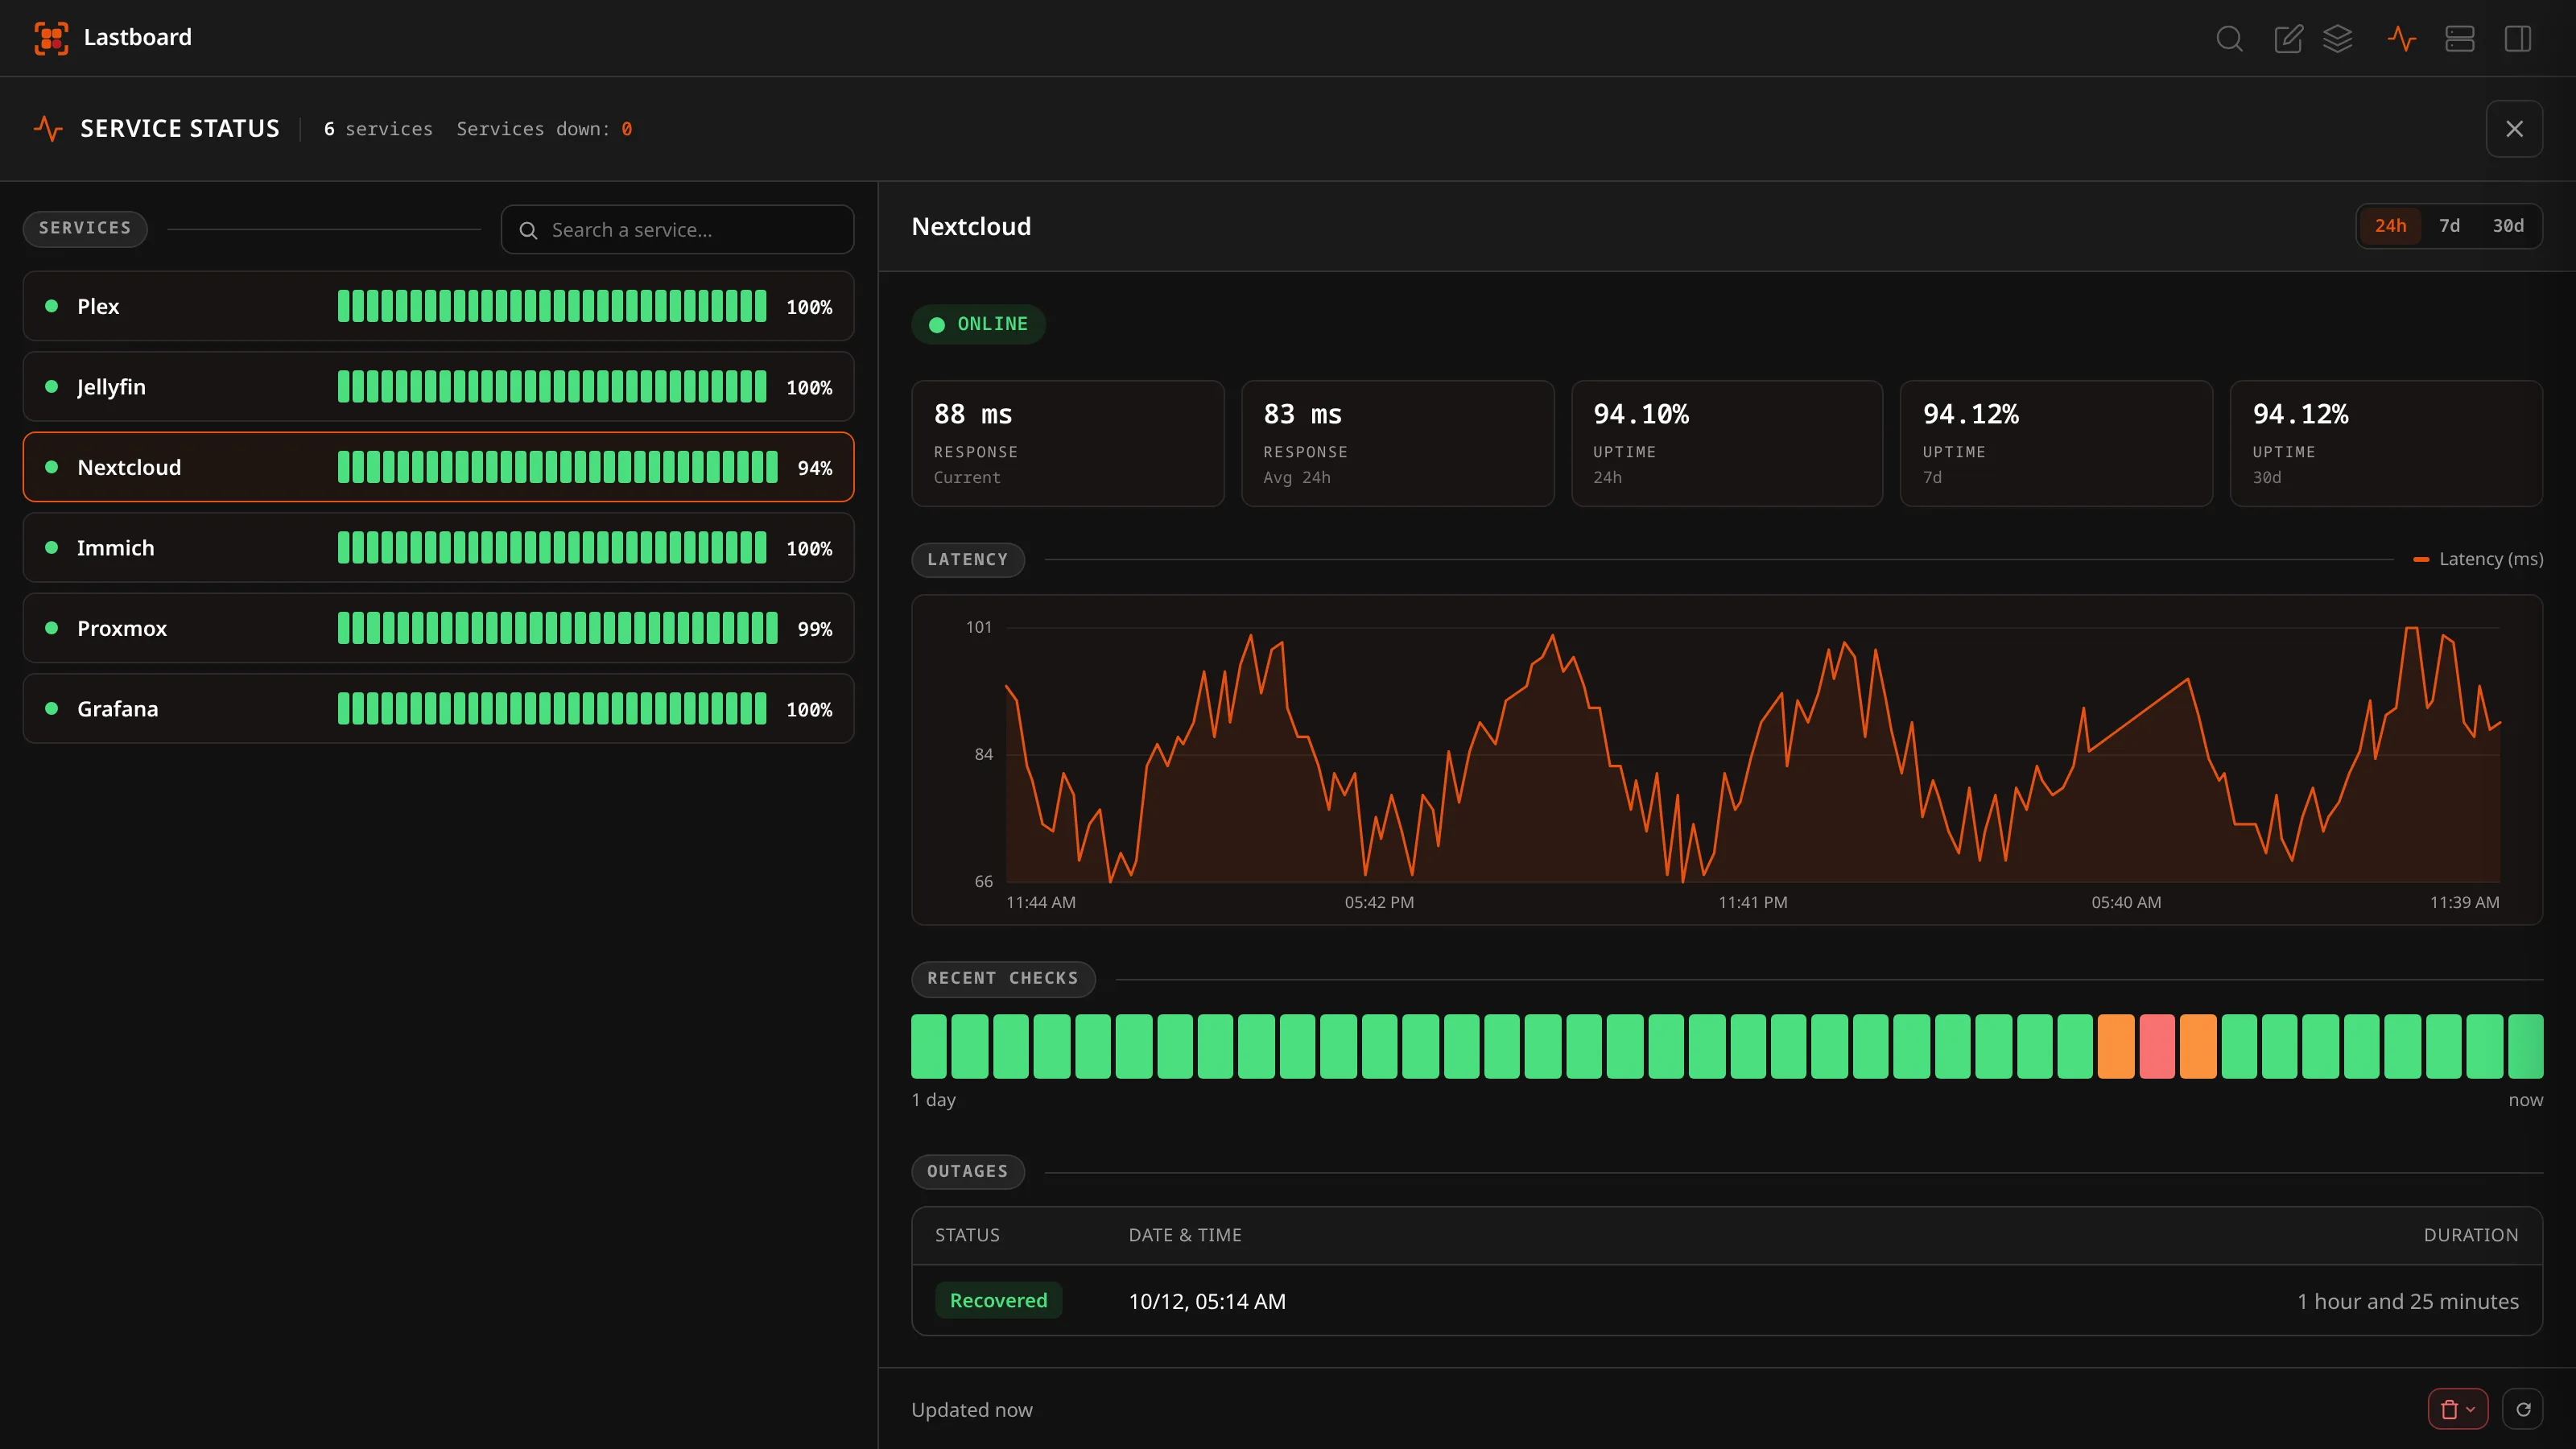
The Service status page lists every monitored service in one place, each with its current state, a recent-checks strip and its 24-hour uptime. It is built from the same pieces as the Proxmox page — the same header, the same section labels, the same cards — because they are two views of one product. With 24/7 monitoring on, open it from the status icon in the top bar. It is always reachable from Settings → Monitoring → View status. Use the search box to filter by name.
Click any service to open its detail view. You can also click the status indicator on a bookmark tile to jump straight to that service’s history.
To keep the same information on the dashboard itself, without opening the page, add the Monitoring widget.
Service Detail
Selecting a service (right-hand panel above) shows its history for a chosen time range (24 hours, 7 days, or 30 days):
| Element | Meaning |
|---|---|
| Uptime | Percentage of successful checks — shown for 24h, 7d, and 30d. |
| Response | Response time, both current and the 24-hour average. |
| Latency chart | Response time plotted across the range, with a hover crosshair. |
| Recent checks | A heartbeat strip of the most recent probes (green = up, red = down). Hover a bar for its timestamp and status. |
| Outages | A table of down periods: status, date & time, duration, and whether the service recovered. An outage keeps its own start and length whatever range you pick: one that began before the range still shows when it really began and how long it really lasted, not the moment the range happens to cut it — as far back as the 30 days of history kept. Durations are written in words and in two units, so nothing needs dividing: 1 day and 1 hour, 9 days and 15 hours, 45 seconds — in your own language, with that language’s plural rules. A clean figure stays clean: 2 days, never 2 days and 0 hours. |
Use Refresh to re-poll immediately; the view also refreshes itself while open.
Clearing History
From a service’s detail view (or Settings → Monitoring → Clear data) you can delete recorded history:
- This service’s history — clears only the selected service.
- History of every service — clears every service’s history.
Clearing data does not turn monitoring off — new checks start accumulating again immediately. This can’t be undone.
Notifications
When 24/7 monitoring is on, Lastboard can send an alert when a service goes down and again when it recovers. Configure this in Settings → Monitoring, in the Notifications card below the monitoring settings — the screenshot at the top of this page shows both cards.
| Setting | Description |
|---|---|
| Alerts | Turns notifications on. Everything below only appears once it is on. |
| Notification method | None, ntfy, Gotify, or Webhook. |
| URL | The ntfy topic URL, the Gotify server URL, or your webhook endpoint. |
| Token | Optional. Bearer token for ntfy/webhook, or the app token for Gotify. Once saved it is never shown: the field holds dots, so you can tell one is there, and has no reveal option. Type a new token to replace it; empty the field to remove it. |
| Fail threshold | How many consecutive failed checks trigger a down alert: 1, 2, 3, or 5. A higher value avoids alerts on brief blips. |
Use Send test to fire a test notification with the current settings and confirm delivery before relying on it.
What each method sends
- ntfy — a message to your topic, titled with the service name. Outages use a high priority and an alarm tag; recoveries use a normal priority and a check-mark tag.
- Gotify — a titled message posted to your Gotify server (
/message), with the app token sent in theX-Gotify-Keyheader so it never appears in a URL or in the logs of anything between Lastboard and Gotify. - Webhook — a JSON payload to your endpoint:
If a token is set, it is sent as an{ "service": "My Service", "status": "down", "message": "…", "timestamp": "2026-01-01T12:00:00Z" }Authorization: Bearer …header.
Alerts are driven by the server-side scheduler, so they require 24/7 monitoring. With it off, nothing is running to notice an outage.