
Documentation / Lastboard / Widgets
Monitoring Widget
On this page
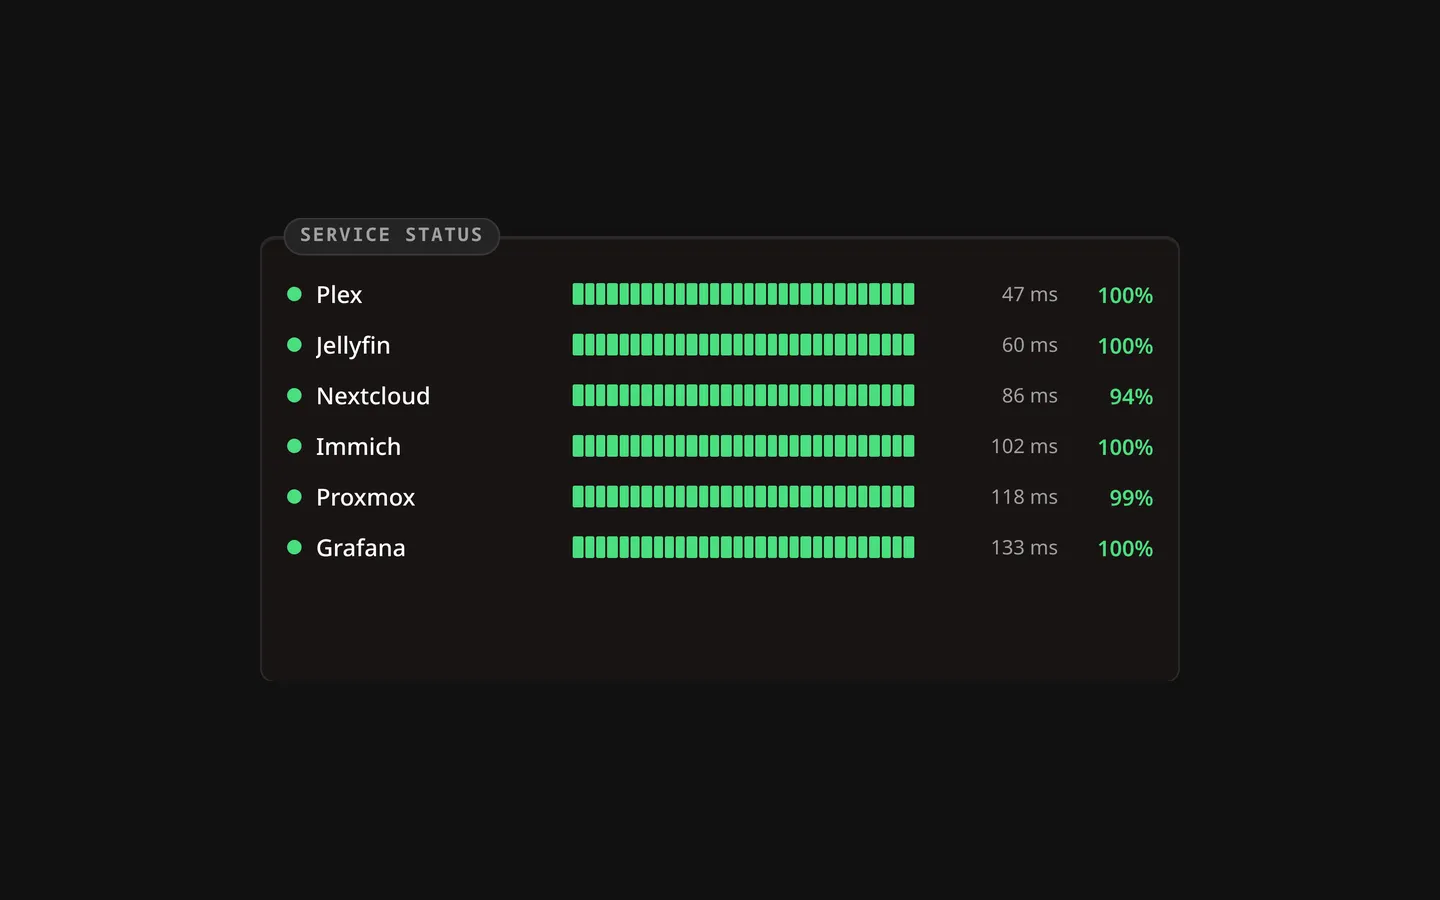
The Monitoring widget puts the status page on your dashboard: which of your services are up, how they have behaved over the last 24 hours, and how long the last check took.
Description
It reads the same data as the full Monitoring & Uptime page, so it shows a service as soon as that service is being monitored — you don’t configure anything twice. Reading a row from left to right:
- a status dot: up, down, or grey when there is no data yet
- the name of the bookmark being monitored
- a heartbeat of the most recent checks, oldest on the left
- the latency of the last successful check
- the uptime over the last 24 hours
Clicking a row opens the same history drawer as the status page, with the outage list and the latency chart.
Requires monitoring to be on. The widget lists services that are already being monitored. Enable 24/7 monitoring and give the bookmarks you care about a Status Position other than Off — see Monitoring & Uptime.
Choosing which services to show
By default every monitored service is shown, including ones you add later. Untick the ones you don’t want in the widget’s configuration.
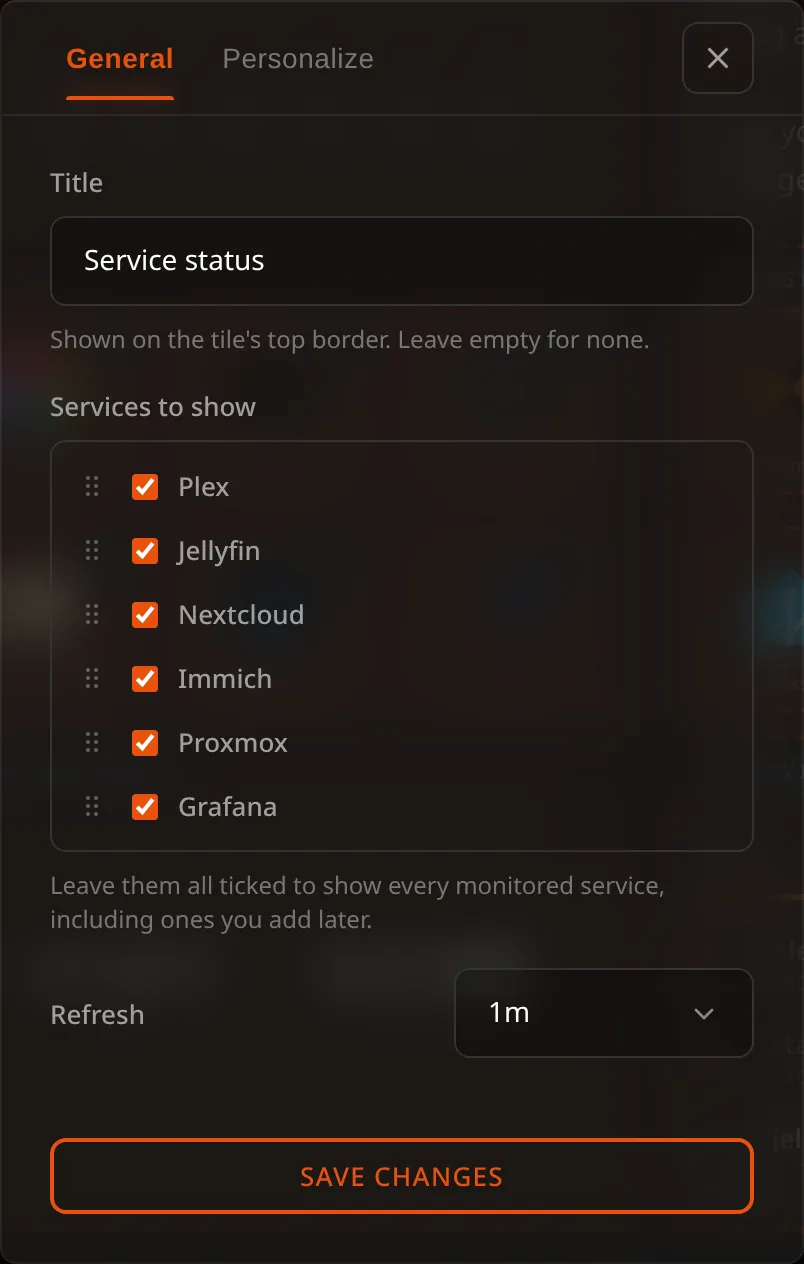
Each service has a grip on its left. Drag a row by it to put the service where you want it on the widget, or focus the grip and use the up and down arrow keys. The order is kept apart from the selection, so arranging a list you left fully ticked does not stop it taking new services: one that appears later is shown after the ones you arranged.
Leaving them all ticked is not the same as ticking them one by one: the widget stores “show everything”, so new services appear on their own. If you pick a subset and later stop monitoring one of them, it simply drops out of the list.
Configuration Options
| Option | Default | Description |
|---|---|---|
| Title | None | A name shown on the tile’s top border. Leave it empty for none. A widget that had no title keeps the name it showed: “Monitoring”, or its name in your language |
| Services to show | All | Which monitored services appear in the widget |
| Refresh | 1 min | How often the widget asks the server for fresh data |
Sizing
The rows adapt to the width you give the widget: on a narrow one the heartbeat moves to its own line so the name stays readable, and on a wider one everything sits on a single line, which fits roughly twice as many services in the same height.